Understanding the Relationship Between SQL Server Session ID and OS Thread ID
When troubleshooting performance issues in SQL Server, you may often want to answer a very practical question: “This OS thread is using a lot of CPU – which SQL Server session and query does it belong to?”
To answer that, you need to understand how Windows processes and threads work, how SQL Server uses SQLOS to schedule work internally, and how sessions, workers, and OS threads are related. Once you know the relationship, you can map a “hot” OS thread back to a specific session_id and query.
In this post, we will:
- Review how processes and threads work at the OS level.
- Look at context switches and their overhead.
- Introduce SQLOS and the concept of workers.
- Explain the relationship between sessions and OS threads.
- Walk through a practical example to map
session_idto OS thread ID using DMVs and Process Explorer.
1. Processes and Threads at the OS Level
Let’s start with a quick recap of how things work in the operating system (Windows) before we dive into SQL Server internals.
- Each process in the OS runs as either a single-threaded or multi-threaded process.
- When a process is multi-threaded, it can use multiple CPUs (logical processors) at the same time and improve overall throughput.
- SQL Server is a multi-threaded process, and it uses many threads for query execution, background tasks, I/O operations, and more.
Multiple threads often share the same CPU core. If one thread is stuck waiting for I/O or some other resource, it can affect overall progress, depending on how the OS scheduler assigns CPU time among threads.
2. Context Switching and Its Overhead
To give each thread a chance to run, the OS scheduler periodically switches the CPU from one thread to another. When a thread has used up its time slice or becomes blocked (for example, waiting for I/O), the CPU is assigned to another runnable thread. This switch between threads is known as a context switch.
Every time a context switch occurs, the OS must:
- Save the current thread’s state (registers, instruction pointer, etc.).
- Restore the next thread’s previously saved state so it can resume execution.
These save/restore operations introduce overhead. On a system with excessive context switching, a noticeable portion of CPU time can be consumed just by saving and loading thread state, instead of doing useful work. Normally, all of this is managed by Windows and is invisible at the application level.
3. Why SQL Server Uses SQLOS (SOS)
SQL Server is “just” a process from the OS point of view, but internally it contains its own scheduling layer called SQLOS (also known as SOS). SQLOS is responsible for managing how work inside SQL Server is assigned to threads.
Why does SQL Server need its own scheduling logic instead of letting Windows handle everything?
If SQL Server fully relied on the OS scheduler, you could end up with problematic situations such as:
- CPU time being assigned to a thread that is just waiting on a lock and cannot make progress.
- Meanwhile, another thread that has already acquired the lock and could actually do useful work gets less CPU time because the OS cannot see SQL Server’s internal wait states.
In other words, from the OS perspective both threads are “runnable”, but only one of them is actually able to move your workload forward.
To avoid this kind of inefficiency, SQL Server uses SQLOS to:
- Understand the internal state of requests (running, waiting on locks, waiting on I/O, etc.).
- Decide which piece of work should get CPU time at a given moment.
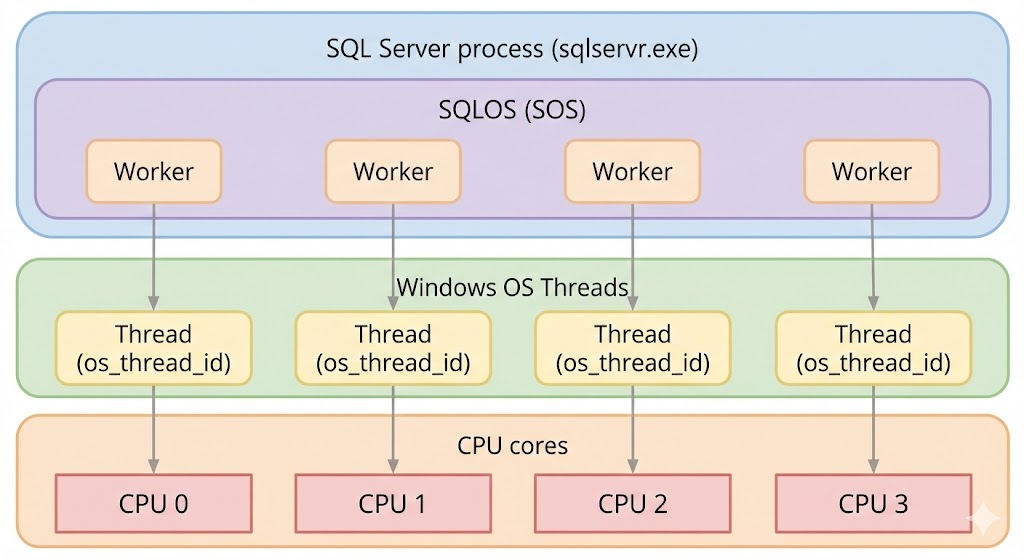
Internally, SQLOS does not schedule “threads” directly. Instead, it works with a logical unit known as a worker. Each worker is ultimately bound to a Windows thread, but the abstraction makes it easier for SQL Server to manage work and track state.
4. Sessions, Workers, and OS Threads: How They Relate
When you monitor SQL Server, you typically start from a session point of view:
- Activity Monitor in SSMS
- Dynamic management views such as
sys.dm_exec_requests - Classic tools like
sp_whoorsp_who2
These tools show you:
- Which session (
session_id) is connected. - What each session is currently executing.
- Which database and login it is using, and so on.
Internally, however, the relationship looks more like this:
- Each session can have one or more requests (for example, individual batches or statements).
- Each request is broken down into one or more tasks.
- Each task is executed by a worker managed by SQLOS.
- Each worker is bound to a specific OS thread (with an OS-level thread ID).
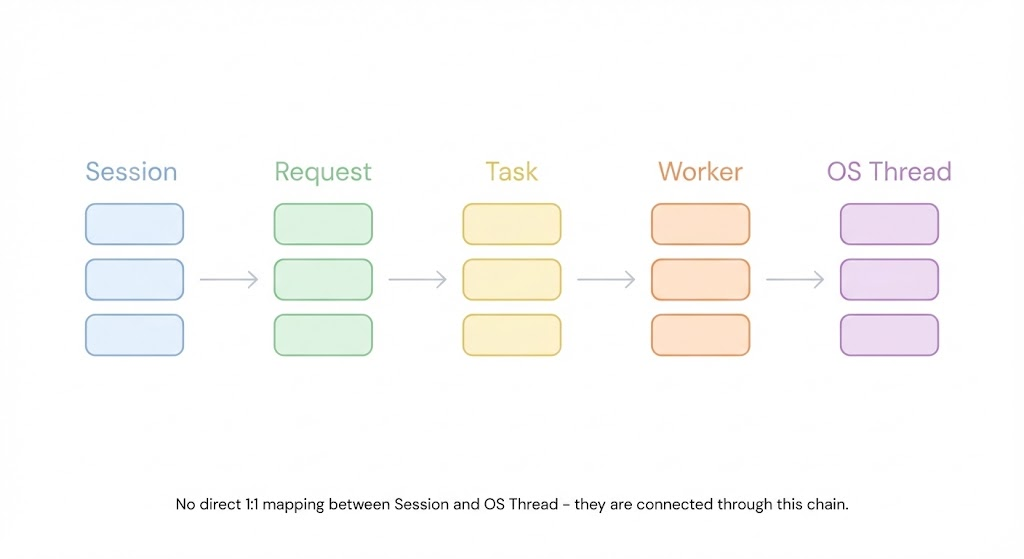
So, there is no direct “session ↔ OS thread” 1:1 mapping. Instead, the mapping is:
Session → Request → Task → Worker → OS Thread
Understanding this chain is the key to connecting what you see at the OS level (thread ID, CPU usage) with what you see inside SQL Server (session, request, query text).
5. How to Map Session ID and OS Thread ID in Practice
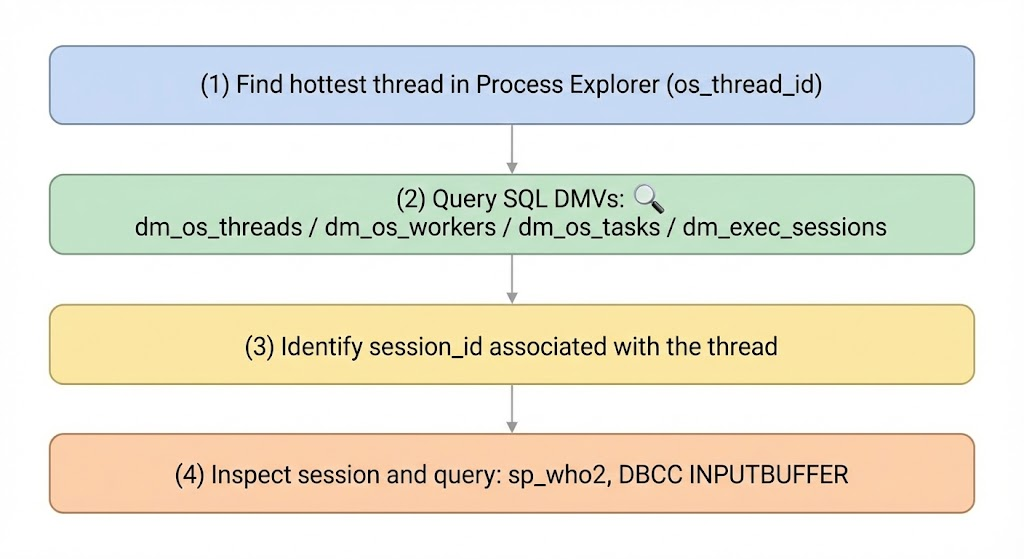
Now let’s look at a practical example. We will:
- Generate a CPU-intensive query from SSMS.
- Use Process Explorer to identify the hottest SQL Server thread.
- Use DMVs to map the OS thread ID back to a SQL Server session.
- Inspect the session and its query using
sp_who2andDBCC INPUTBUFFER.
5.1 Tools You Need
For this example, we’ll use the following:
- Process Explorer – to check which thread in the
sqlservr.exeprocess is using the most CPU.
You can download Process Explorer from Microsoft: Process Explorer – Sysinternals | Microsoft Learn
On the SQL Server side, you also need permissions to query DMVs such as sys.dm_os_threads, sys.dm_os_workers, and sys.dm_exec_sessions (typically VIEW SERVER STATE).
5.2 Generate a High-CPU Test Query
First, we generate a CPU-intensive query from SSMS so that we have something easy to find. In this example, the session ID is 85.
SELECT TOP (10000000)
    SUM(
        CAST(ABS(CHECKSUM(a.object_id)) AS BIGINT) +
        CAST(ABS(CHECKSUM(b.object_id)) AS BIGINT) +
        CAST(ABS(CHECKSUM(c.object_id)) AS BIGINT) +
        CAST(ABS(CHECKSUM(d.object_id)) AS BIGINT) +
        CAST(ABS(CHECKSUM(a.name)) AS BIGINT) +
        CAST(ABS(CHECKSUM(b.name)) AS BIGINT) +
        CAST(ABS(CHECKSUM(c.name)) AS BIGINT) +
        CAST(ABS(CHECKSUM(d.name)) AS BIGINT)
    ) OVER () AS calc
FROM sys.objects a
CROSS JOIN sys.objects b
CROSS JOIN sys.objects c
CROSS JOIN sys.objects d
OPTION (MAXDOP 4);
This query performs a lot of CPU work by cross joining sys.objects and applying various checksum calculations. It is not meant for production, only as a convenient way to create CPU load for testing.
5.3 Find the Hottest Thread in Process Explorer
Next, open Process Explorer and locate the sqlservr.exe process. Open its properties and switch to the Threads tab.
Sort the threads by CPU usage in descending order. You should see one thread consuming the most CPU. In this example, the top thread has thread ID 4996.

Make a note of this thread ID; we will use it in the next query.
5.4 Map OS Thread ID to SQL Server Session Using DMVs
Now we use SQL Server DMVs to map the OS thread ID to a SQL Server session. The following query joins threads, workers, tasks, and sessions:
SELECT
    t.os_thread_id,
    s.session_id,
    s.program_name
FROM sys.dm_os_threads AS t
JOIN sys.dm_os_workers AS w
    ON t.worker_address = w.worker_address
JOIN sys.dm_os_tasks AS k
    ON w.task_address = k.task_address
JOIN sys.dm_exec_sessions AS s
    ON k.session_id = s.session_id
WHERE t.os_thread_id = 4996;  -- Replace with your thread ID
Replace 4996 with the OS thread ID you found in Process Explorer. The result will show:
os_thread_id– the OS thread ID (should match what you saw in Process Explorer).session_id– the SQL Server session associated with this worker/thread.program_name– the client program (for example, “Microsoft SQL Server Management Studio”).
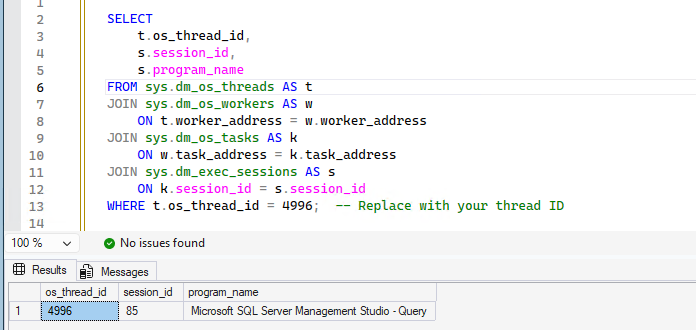
In our test, the query shows that the hot thread is associated with session_id = 85, which matches the session running our CPU-intensive query.
5.5 Inspect the Session and Its Query
Once you know the session_id, you can use classic tools to inspect what the session is doing. For example:
-- Replace xxx with the session_id returned by the DMV query
EXEC sp_who2 xxx;
DBCC INPUTBUFFER(xxx);
sp_who2 gives you an overview of the session (login, database, CPU time, status, etc.), and DBCC INPUTBUFFER shows the last statement sent by the client on that session. Together, they allow you to confirm:
- Which session is tied to the high-CPU thread.
- What query that session is executing.

6. Summary
In this article, we first reviewed how OS processes and threads work, then looked at context switching and why it introduces overhead. We also discussed why SQL Server uses SQLOS and workers instead of relying solely on the Windows scheduler.
Internally, the relationship between sessions and OS threads is:
Session → Request → Task → Worker → OS Thread
Finally, we walked through a practical example where we:
- Generated a high-CPU query in SSMS.
- Used Process Explorer to find the hottest SQL Server thread.
- Mapped the OS thread ID to
session_idusing DMVs. - Inspected the session and query using
sp_who2andDBCC INPUTBUFFER.
With this approach, you can start from OS-level data (a hot thread ID) and drill all the way down to the exact SQL Server session and query responsible for the CPU usage. This is especially useful when your monitoring tools focus on OS metrics, but you still need to identify the root cause inside SQL Server.
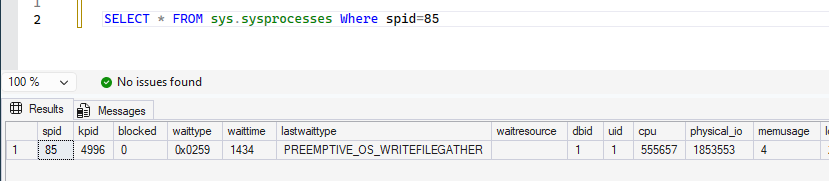
In the examples above, we used several DMV-based queries to map SQL Server sessions to OS thread IDs. If you just want a quick one-shot check, you can also use the legacy compatibility view sys.sysprocesses, which exposes both the session ID (spid) and the Windows thread ID (kpid) in a single query. In our scenario, running SELECT * FROM sys.sysprocesses returns the following row, where the spid matches the session we identified and the kpid matches the OS thread ID from Process Explorer.