Error: 1205 – Transaction Process ID was deadlocked on lock resources
In the high-concurrency world of SQL Server, Error 1205 (Deadlock) is the ultimate stalemate. Unlike blocking, where one process eventually finishes, a deadlock involves two processes waiting on each other. SQL Server must intervene and “kill” one session to allow the other to survive.
While basic tutorials explain what a deadlock is, this guide focuses on how to capture and analyze them using diagnostic tools like the System Health Session and Trace Flags.
1. Error Details
Msg 1205, Level 13, State 51, Line 8
Transaction (Process ID xxx) was deadlocked on lock resources with another process and has been chosen as the deadlock victim. Rerun the transaction.
2. Understanding Deadlocks: The Mechanics
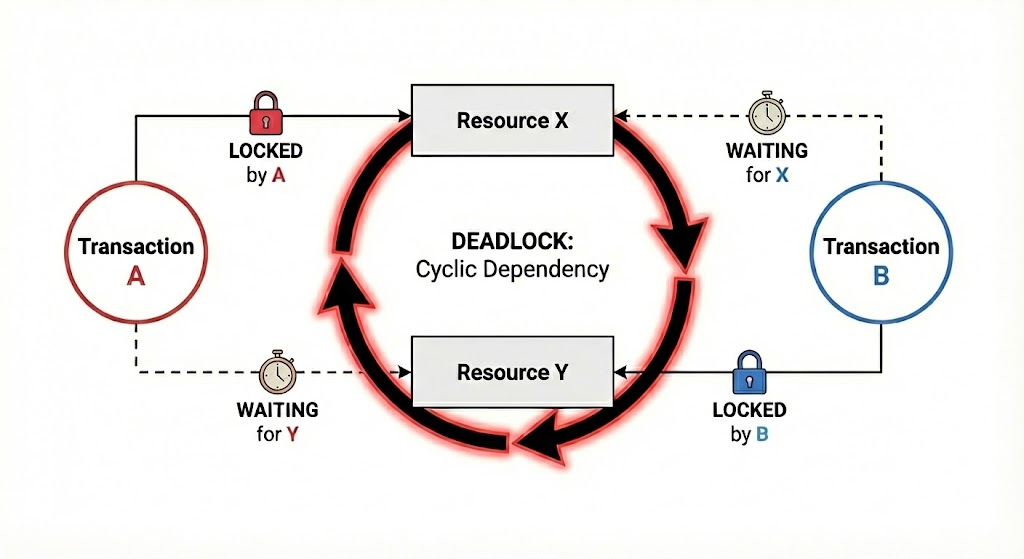
Before reproducing the error, it is crucial to understand what is happening under the hood. A deadlock is not just “blocking”; it is a circular chain of dependencies that can never resolve itself.
The Cyclic Dependency
A deadlock occurs when two or more tasks permanently block each other because each task has a lock on a resource which the other tasks are trying to lock. For example:
- Transaction A: Holds a lock on Row 1 and requests a lock on Row 2.
- Transaction B: Holds a lock on Row 2 and requests a lock on Row 1.
Because neither transaction can proceed without the other releasing its lock, they would wait forever. This is where SQL Server intervenes.

How SQL Server Chooses the “Victim”
SQL Server has a background thread called the Lock Monitor that wakes up every 5 seconds (or faster if deadlocks are frequent) to check for these cycles. When a cycle is detected, SQL Server must end it by “killing” one of the sessions.
The session chosen to be killed is called the Deadlock Victim. SQL Server chooses the victim based on the following criteria:
- Deadlock Priority: If a session has explicitly set a lower
SET DEADLOCK_PRIORITY(e.g., LOW), it will be chosen as the victim. - Rollback Cost: If priorities are equal (which is the default), SQL Server estimates the “cost” to roll back each transaction. The transaction that has done the least amount of work (written the fewest log records) is usually chosen as the victim. This minimizes the performance impact on the system.
The victim session receives Error 1205, and its transaction is rolled back automatically. The surviving session continues processing normally.
3. Reproduction Steps
To analyze a deadlock, we first need to create one. We will force a classic “Order of Operations” cyclic deadlock.
Setup: Open SQL Server Management Studio (SSMS) and create two tables.
-- Setup Database
CREATE DATABASE DeadlockLab;
GO
USE DeadlockLab;
GO
CREATE TABLE dbo.TableA (ID INT PRIMARY KEY, Name VARCHAR(10));
CREATE TABLE dbo.TableB (ID INT PRIMARY KEY, Name VARCHAR(10));
INSERT INTO dbo.TableA VALUES (1, 'A');
INSERT INTO dbo.TableB VALUES (1, 'B');
GO
Step 1 (Session A): Run this in the first query window.
USE DeadlockLab;
GO
BEGIN TRAN;
-- 1. Acquire lock on TableA
UPDATE dbo.TableA SET Name = 'A_Upd' WHERE ID = 1;

-- 2. Wait for Session B to start and acquire its lock
WAITFOR DELAY '00:00:10';

-- 3. Attempt to access TableB (will block)
UPDATE dbo.TableB SET Name = 'B_Upd' WHERE ID = 1;
ROLLBACK TRAN;
Step 2 (Session B): Immediately run this in a second window.
USE DeadlockLab;
GO
BEGIN TRAN;
-- 1. Acquire lock on TableB
UPDATE dbo.TableB SET Name = 'B_Upd' WHERE ID = 1;

-- 2. Attempt to access TableA (will block immediately, creating the cycle)
UPDATE dbo.TableA SET Name = 'A_Upd' WHERE ID = 1;
ROLLBACK TRAN;
4. How to Analyze Deadlocks
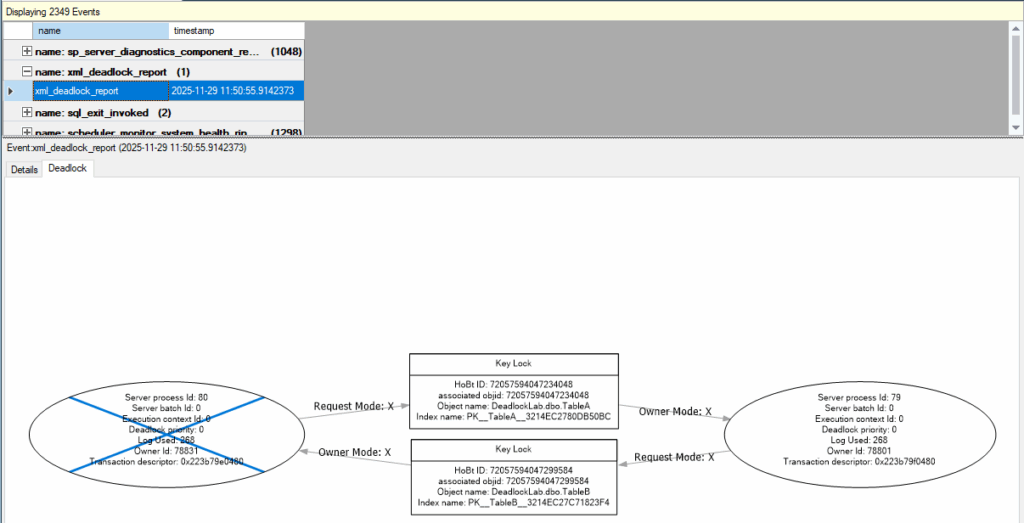
When Error 1205 occurs, the victim session is rolled back, and the error disappears. To prevent it from happening again, you need the Deadlock Graph. Here are the two best ways to retrieve it.
Method A: Using the System Health Session (Best Practice)
You do not need to set up a profiler trace in advance. By default, SQL Server runs an Extended Events session called system_health which automatically captures deadlock graphs.
Option 1: Using the GUI
- In SSMS, navigate to Management > Extended Events > Sessions > system_health.
- Right-click package0.event_file and select View Target Data.
- In the viewer, filter the events by name:
xml_deadlock_report. - Double-click the XML report to visualize the Deadlock Graph.

Option 2: Using T-SQL (For Pros)
You can also query the Ring Buffer target directly to see recent deadlocks without leaving the query window. Selecting the cell that appears as a hyperlink in the results will display the XML in the Deadlock_XML column within SSMS. To visualize this, save the output as an .xdl file, close it, and then reopen the .xdl file in SSMS to view the graphical Deadlock Graph.
-- Extract Deadlock Graphs from System Health Ring Buffer
WITH cteDeadLocks ([Deadlock_XML])
AS (SELECT CAST (target_data AS XML) AS [Deadlock_XML]
FROM sys.dm_xe_sessions AS xs
INNER JOIN sys.dm_xe_session_targets AS xst
ON xs.[address] = xst.event_session_address
WHERE xs.[name] = 'system_health'
AND xst.target_name = 'ring_buffer')
SELECT x.Graph.query('(event/data/value/deadlock)[1]') AS Deadlock_XML,
x.Graph.value('(event/data/value/deadlock/process-list/process/@lastbatchstarted)[1]', 'datetime2(3)') AS when_occurred,
DB_Name(x.Graph.value('(event/data/value/deadlock/process-list/process/@currentdb)[1]', 'int')) AS DB --Current database of the first listed process
FROM (SELECT Graph.query('.') AS Graph
FROM cteDeadLocks AS c
CROSS APPLY c.[Deadlock_XML].nodes('RingBufferTarget/event[@name="xml_deadlock_report"]') AS Deadlock_Report(Graph)) AS x
ORDER BY when_occurred DESC;
Method B: Using Trace Flags (Logging)
If you use log scraping tools (like Splunk or Datadog) to monitor your SQL Server, you might prefer writing deadlock details directly to the SQL Server Error Log. You can achieve this using Trace Flags.
- Trace Flag 1222 (Recommended): Writes the deadlock information in an XML-like format that clearly shows resources and processes.
- Trace Flag 1204: The older text-based format. Harder to parse.
To enable Trace Flag 1222 globally (persistently until restart):
-- Enable Trace Flag 1222 Global Scope
DBCC TRACEON (1222, -1);
GO

-- Check status
DBCC TRACESTATUS;
GO
Once enabled, whenever a deadlock occurs, check the Error Log (SSMS > Management > SQL Server Logs). You will see a detailed entry explaining the victim and the winner.

5. Error Resolution
Once you have the graph from the methods above, identify the Cyclic Dependency and consider the following solutions:
- Fix Order of Access: Ensure all applications access tables in the same order (e.g., Always update Table A then Table B). This eliminates the cycle potential.
- Add Covering Indexes: Often, a query locks a Clustered Index (the whole table) because it needs a column not in the Non-Clustered Index. Adding that column as an
INCLUDEcolumn can change the lock from a Table/Page lock to a single Row lock, avoiding the conflict. - Use Retry Logic: Always wrap transactions in a
TRY...CATCHblock in your application code. When Error 1205 is caught, the application should automatically retry the transaction, as transient deadlocks often resolve on the second attempt. - Change Transaction Isolation Level: If Shared (S) locks are contributing to the deadlock, changing the isolation level from the default
READ COMMITTEDtoREAD COMMITTED SNAPSHOT (RCSI)can resolve the issue. RCSI uses row versioning instead of locking for read operations, meaning SELECT statements will no longer block (or be blocked by) WRITE operations. - Keep Transactions Short: If a single transaction performs many changes, the probability of lock contention with other transactions increases significantly. Therefore, break down large transactions into smaller batches whenever possible to release locks faster.
