
What You’ll Learn: Execution plans are the roadmap SQL Server uses to retrieve data. Understanding how to read and interpret them is one of the most valuable skills for any DBA or developer. This comprehensive guide teaches you how to analyze execution plans, identify performance bottlenecks, and optimize your queries for maximum efficiency.
Table of Contents
- 1. Introduction to Execution Plans
- 2. Types of Execution Plans
- 3. How to Get Execution Plans
- 4. Reading Graphical Execution Plans
- 5. Understanding Key Operators
- 6. Critical Performance Metrics
- 7. Identifying Common Performance Problems
- 8. Query Optimization Techniques
- 9. Advanced Topics
- 10. Best Practices
1. Introduction to Execution Plans
When you execute a query in SQL Server, the database engine doesn’t immediately start retrieving data. Instead, it goes through a sophisticated process to determine the most efficient way to execute your query. The result of this process is an execution plan.
What is an Execution Plan?
An execution plan is a detailed breakdown of the steps SQL Server will take (or has taken) to execute a query. It shows:
- Which tables and indexes are accessed
- The order in which tables are joined
- Which join algorithms are used
- How data is sorted, filtered, and aggregated
- The estimated or actual cost of each operation
- The number of rows processed at each step
Why Are Execution Plans Important?
Execution plans are essential for:
- Performance Tuning: Identifying why queries are slow
- Index Design: Understanding which indexes are used (or missing)
- Query Optimization: Finding inefficient operations
- Troubleshooting: Diagnosing unexpected query behavior
- Capacity Planning: Understanding resource consumption
The Query Optimization Process
SQL Server uses a cost-based optimizer that follows these steps:
- Parsing: Checks syntax and converts query to internal format
- Binding: Verifies objects exist and resolves names
- Optimization: Query Optimizer generates multiple possible plans and estimates the cost of each
- Plan Selection: Chooses the plan with the lowest estimated cost
- Execution: Executes the chosen plan and returns results
2. Types of Execution Plans
2.1 Estimated vs. Actual Execution Plans
Estimated Execution Plan
An estimated plan shows what SQL Server plans to do without actually executing the query.
- Pros: Fast to generate, doesn’t require query execution, safe for production
- Cons: Based on statistics estimates, may not reflect actual runtime behavior
- Use when: Analyzing expensive queries, testing index changes, reviewing query design
Actual Execution Plan
An actual plan shows what SQL Server actually did during query execution.
- Pros: Shows real row counts, actual runtime statistics, reveals runtime issues
- Cons: Requires full query execution, may be expensive on production
- Use when: Diagnosing performance issues, validating optimizations, analyzing parameter sniffing
Key Differences
| Aspect | Estimated Plan | Actual Plan |
|---|---|---|
| Query Execution | Not required | Required |
| Row Counts | Estimated from statistics | Actual rows processed |
| Runtime Metrics | Not available | CPU time, I/O, waits |
| Production Safety | Safe | Use with caution |
2.2 Graphical vs. Text Plans
Graphical Plans (XML-based)
Visual representation shown in SSMS with icons and flow diagrams. Best for interactive analysis and detailed investigation.
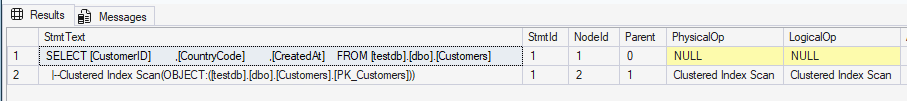
Text Plans
Text-based output using SET SHOWPLAN_TEXT or SET SHOWPLAN_ALL. Useful for scripting, logging, and automated analysis.
3. How to Get Execution Plans
3.1 Using SQL Server Management Studio (SSMS)
Estimated Plan
-- Method 1: Toolbar button or Ctrl+L
-- Click "Display Estimated Execution Plan" in SSMS

-- Method 2: Using SET SHOWPLAN_XML
SET SHOWPLAN_XML ON;
GO
SELECT * FROM Sales.Orders WHERE OrderDate > '2024-01-01';
GO
SET SHOWPLAN_XML OFF;
GO
Actual Plan
-- Method 1: Toolbar button or Ctrl+M (Include Actual Execution Plan)
-- Then execute the query

-- Method 2: Using SET STATISTICS XML
SET STATISTICS XML ON;
GO
SELECT * FROM Sales.Orders WHERE OrderDate > '2024-01-01';
GO
SET STATISTICS XML OFF;
GO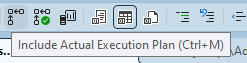
3.2 Getting Plans from DMVs
Retrieve execution plans for queries already executed and cached:
-- Get plans from query cache
SELECT
    qs.execution_count,
    qs.total_worker_time / 1000 AS total_cpu_ms,
    qs.total_elapsed_time / 1000 AS total_duration_ms,
    SUBSTRING(
        qt.text,
        (qs.statement_start_offset/2) + 1,
        ((CASE qs.statement_end_offset
            WHEN -1 THEN DATALENGTH(qt.text)
            ELSE qs.statement_end_offset
        END - qs.statement_start_offset)/2) + 1
    ) AS query_text,
    qp.query_plan
FROM sys.dm_exec_query_stats AS qs
CROSS APPLY sys.dm_exec_sql_text(qs.sql_handle) AS qt
CROSS APPLY sys.dm_exec_query_plan(qs.plan_handle) AS qp
ORDER BY qs.total_worker_time DESC;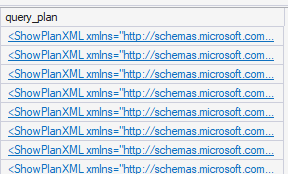
3.3 Capturing Plans with Extended Events
-- Create Extended Events session to capture query plans
CREATE EVENT SESSION [CaptureQueryPlans] ON SERVER
ADD EVENT sqlserver.query_post_execution_showplan(
    WHERE (
        duration > 1000000  -- Queries longer than 1 second (microseconds)
    )
)
ADD TARGET package0.event_file(
    SET filename = N'C:\Temp\QueryPlans.xel',
    max_file_size = 100
);

-- Start the session
ALTER EVENT SESSION [CaptureQueryPlans] ON SERVER STATE = START;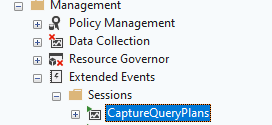
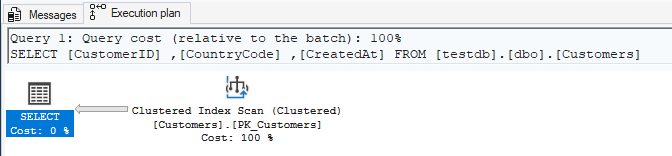
4. Reading Graphical Execution Plans
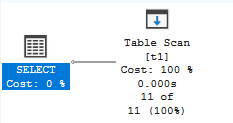
4.1 Basic Structure
Execution plans in SSMS are displayed as a tree of operators flowing from right to left:
- Right side: Data sources (tables, indexes)
- Middle: Operations (joins, sorts, aggregations)
- Left side: Final result (SELECT operator)
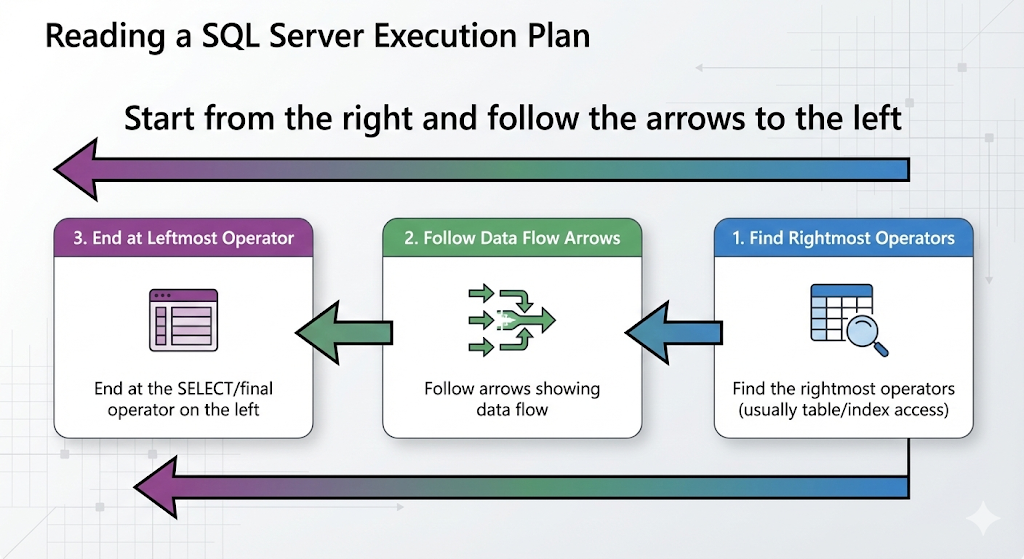
4.2 Reading Flow
Start from the right and follow the arrows to the left:
- Find the rightmost operators (usually table/index access)
- Follow arrows showing data flow
- Look at each operator’s properties
- End at the SELECT operator on the left
4.3 Understanding Thickness of Arrows
Arrow thickness indicates the relative number of rows flowing between operators:
- Thin arrow: Few rows
- Medium arrow: Moderate number of rows
- Thick arrow: Large number of rows
⚠️ Important: A suddenly thick arrow can indicate a problem, such as a missing WHERE clause or Cartesian product.
4.4 Cost Percentages
Each operator shows a cost percentage relative to the total query cost. Focus on operators with high percentages (typically >10%).
💡 Tip: The cost is an estimate used by the optimizer. In actual execution, these percentages might not match real resource consumption.
4.5 Operator Properties
Right-click any operator or hover over it to see detailed properties:
- Estimated vs. Actual Row Count: Large discrepancies indicate statistics problems
- Estimated I/O Cost: Disk read operations
- Estimated CPU Cost: Processing cost
- Estimated Execution Mode: Row or Batch mode
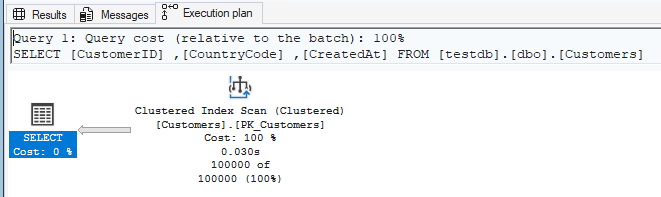
- Actual Number of Rows: Rows processed (actual plans only)
5. Understanding Key Operators
5.1 Data Access Operators
Table Scan
Reads every row in a table (heap or clustered index).
- When it’s OK: Small tables, reading most/all rows
- Problem sign: Large tables with selective queries
- Solution: Create appropriate indexes
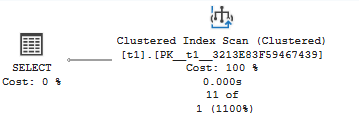
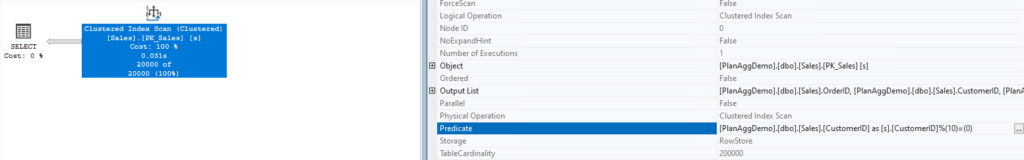
Clustered Index Scan
Reads all rows from a clustered index.
- When it’s OK: Queries returning large percentage of rows
- Problem sign: Selective queries on large tables
- Solution: Create nonclustered indexes on filter columns
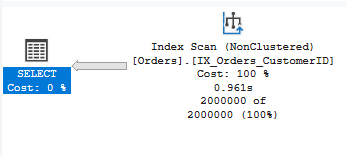
Index Scan
Reads all rows from a nonclustered index.
- When it’s OK: Index covers the query and most rows are needed
- Problem sign: Scanning when seeking would be better
- Solution: Review index design and query predicates
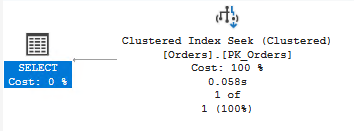
Index Seek
Uses index to find specific rows efficiently. This is usually what you want!
- Characteristics: Fast, low I/O, scalable
- Requirements: Usable index, SARGable predicates
- Cost: Logarithmic with table size
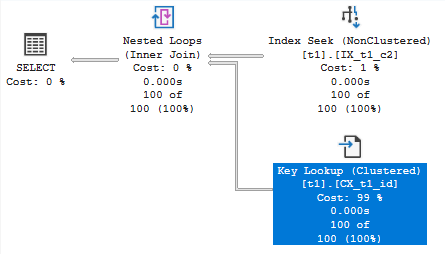
Key Lookup (RID Lookup)
After an index seek, goes to the base table to retrieve additional columns.
- Performance impact: Can be expensive with many rows
- Solution: Create covering index with INCLUDE columns
- Warning sign: High estimated number of executions
5.2 Join Operators
This below document also explains about join operaters.
Nested Loops Join
For each row from the outer input, scans the inner input.
- Best for: Small outer input, indexed inner input
- Performance: O(N*M) – can be fast with small inputs
- Problem sign: Large outer input with many iterations
Hash Match (Hash Join)
Builds hash table from one input, probes it with the other.
- Best for: Large, unsorted inputs without useful indexes
- Performance: O(N+M) – good for large datasets
- Memory: Requires memory grant for hash table
- Warning: Can spill to tempdb if insufficient memory
Merge Join
Merges two sorted inputs.
- Best for: Large, pre-sorted inputs (indexed columns)
- Performance: O(N+M) – very efficient
- Requirement: Both inputs must be sorted on join keys
- Note: Often fastest join type when applicable
5.3 Aggregation Operators
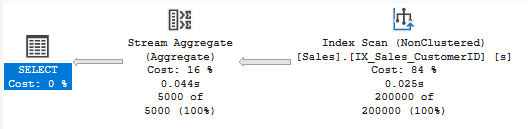
Stream Aggregate
Processes sorted input in a single pass.
- Performance: Very efficient
- Requirement: Input must be sorted by GROUP BY columns
- Common with: Queries with indexes on GROUP BY columns
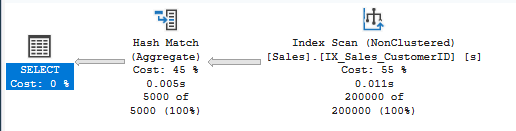
Hash Match (Aggregate)
Uses hash table to group rows.
- Performance: Good for unsorted data
- Memory: Requires memory grant
- Warning: Can indicate missing index on GROUP BY columns
5.4 Other Important Operators
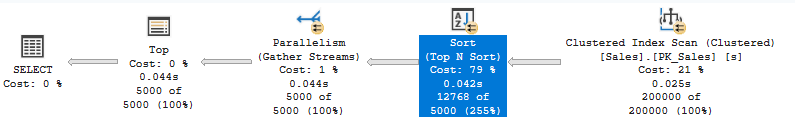
Sort
Sorts data in memory or tempdb.
- Cost: Can be expensive for large datasets
- Memory: May spill to tempdb
- Solution: Create indexes to provide pre-sorted data
Filter
Applies WHERE clause predicates that couldn’t be pushed to index operations.
- Warning sign: May indicate non-SARGable predicates
- Review: Check if predicates can be optimized
Compute Scalar
Computes calculated expressions.
- Usually: Low cost and necessary
- Check: If cost is high, review complex expressions
6. Critical Performance Metrics
6.1 Row Count Estimation
Compare estimated vs. actual row counts in operator properties:
Good Estimation
Estimated Number of Rows: 1000
Actual Number of Rows: 1050
-- Difference: ~5% - Good!
Poor Estimation (Statistics Problem)
Estimated Number of Rows: 100
Actual Number of Rows: 500000
-- Difference: 5000x - Problem!

-- Solution: Update statistics
UPDATE STATISTICS Sales.Orders WITH FULLSCAN;
💡 Tip: Large estimation errors often indicate outdated statistics or parameter sniffing issues.
6.2 I/O and CPU Metrics
Enable IO and TIME statistics to see resource consumption:
SET STATISTICS IO ON;
SET STATISTICS TIME ON;
GO

SELECT * FROM Sales.Orders WHERE CustomerID = 12345;
GO

SET STATISTICS IO OFF;
SET STATISTICS TIME OFF;
GO

-- Output example:
-- Table 'Orders'. Scan count 1, logical reads 425, physical reads 0
-- SQL Server Execution Times:
--    CPU time = 156 ms,  elapsed time = 189 ms
Understanding the Metrics
| Metric | Description | Good Value |
|---|---|---|
| Logical Reads | Pages read from buffer cache | Low as possible |
| Physical Reads | Pages read from disk | 0 (already cached) |
| Read-ahead Reads | Pages read speculatively | Varies |
| Scan Count | Number of seeks/scans | Low for seeks |
6.3 Memory Grants
Check if operators are getting enough memory:
- Memory Grant: Memory allocated to query
- Used Memory: Actually used
- Warning: Spills to tempdb indicate insufficient memory
Query to check memory grants:
SELECT
    session_id,
    request_id,
    granted_memory_kb / 1024 AS granted_memory_mb,
    used_memory_kb / 1024 AS used_memory_mb
FROM sys.dm_exec_query_memory_grants
WHERE session_id > 50;
7. Identifying Common Performance Problems
7.1 Missing Indexes
Look for these signs in execution plans:
- Green “Missing Index” hint at top of plan
- Table/Index Scans on large tables with selective predicates
- Key Lookups with high row counts
-- Example query with missing index
SELECT OrderID, OrderDate, TotalAmount
FROM Sales.Orders
WHERE CustomerID = 12345  -- No index on CustomerID
AND OrderDate > '2024-01-01';

-- Creates: Table Scan or Clustered Index Scan
-- Should be: Index Seek on CustomerID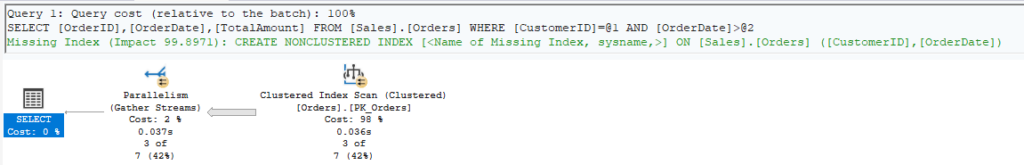
7.2 Implicit Conversions
Yellow warning triangle on operators indicates implicit conversion:
-- Problem: Implicit conversion prevents index usage
CREATE TABLE dbo.Products (ProductCode VARCHAR(20) PRIMARY KEY);

-- Query with implicit conversion
SELECT * FROM dbo.Products
WHERE ProductCode = N'ABC123';  -- NVARCHAR literal
-- Shows: CONVERT_IMPLICIT in plan, index not used efficiently

-- Solution: Match data types
SELECT * FROM dbo.Products
WHERE ProductCode = 'ABC123';  -- VARCHAR literal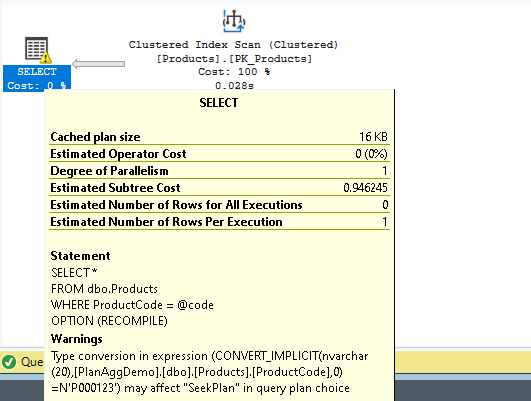
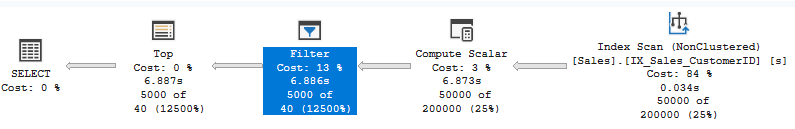
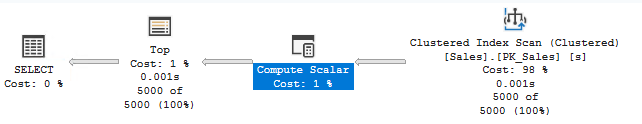
7.3 Parameter Sniffing
Different execution for different parameter values:
-- Procedure compiled for CustomerID = 1 (1 order)
CREATE PROCEDURE dbo.GetCustomerOrders @CustomerID INT
AS
    SELECT * FROM Sales.Orders WHERE CustomerID = @CustomerID;
GO

-- First execution: CustomerID = 1 (few rows)
-- Plan: Index Seek + Key Lookup - Good for small result sets

-- Later execution: CustomerID = 999 (10,000 rows)
-- Uses same plan: Index Seek + Key Lookup
-- Bad! Should use Clustered Index Scan for many rows

-- Solution 1: OPTION (RECOMPILE)
SELECT * FROM Sales.Orders
WHERE CustomerID = @CustomerID
OPTION (RECOMPILE);

-- Solution 2: OPTION (OPTIMIZE FOR)
SELECT * FROM Sales.Orders
WHERE CustomerID = @CustomerID
OPTION (OPTIMIZE FOR (@CustomerID = 999));

-- Solution 3: Use local variable
DECLARE @LocalCustomerID INT = @CustomerID;
SELECT * FROM Sales.Orders WHERE CustomerID = @LocalCustomerID;
7.4 Table Spools
Table Spool operators can indicate inefficient query plans:
- Lazy Spool: Temporary table built on demand
- Eager Spool: Entire temporary table built immediately
- Problem: Can indicate poor query design or missing indexes
- Solution: Review query logic, consider rewriting
8. Query Optimization Techniques
8.1 Creating Covering Indexes
Eliminate key lookups by including all needed columns:
-- Original query with Key Lookup
SELECT CustomerID, OrderDate, TotalAmount
FROM Sales.Orders
WHERE OrderStatus = 'Pending';

-- Original plan shows:
-- Index Seek on IX_OrderStatus
-- + Key Lookup to get OrderDate, TotalAmount

-- Solution: Covering index
CREATE INDEX IX_OrderStatus_Covering
ON Sales.Orders (OrderStatus)
INCLUDE (OrderDate, TotalAmount);

-- New plan: Just Index Seek, no Key Lookup!
8.2 Writing SARGable Queries
SARGable (Search ARGument able) predicates allow index seeks:
Non-SARGable (Bad)
-- Functions on column prevent index usage
SELECT * FROM Sales.Orders
WHERE YEAR(OrderDate) = 2024;  -- Can't use index on OrderDate

SELECT * FROM Sales.Customers
WHERE UPPER(LastName) = 'SMITH';  -- Can't use index on LastName

SELECT * FROM Sales.Products
WHERE ProductCode LIKE '%ABC%';  -- Can't use index (leading wildcard)
SARGable (Good)
-- Allow index usage
SELECT * FROM Sales.Orders
WHERE OrderDate >= '2024-01-01' AND OrderDate < '2025-01-01';

SELECT * FROM Sales.Customers
WHERE LastName = 'Smith';  -- Or use computed column with index

SELECT * FROM Sales.Products
WHERE ProductCode LIKE 'ABC%';  -- No leading wildcard
8.3 Optimizing JOIN Order
SQL Server usually chooses the best join order, but you can influence it:
-- Force specific join order with OPTION (FORCE ORDER)
SELECT o.OrderID, c.CustomerName, p.ProductName
FROM Sales.SmallTable o  -- Start with smallest table
INNER JOIN Sales.LargeTable c ON o.CustomerID = c.CustomerID
INNER JOIN Sales.HugeTable p ON o.ProductID = p.ProductID
OPTION (FORCE ORDER);  -- Use with caution!

-- Better: Let optimizer decide, but provide good indexes and statistics
8.4 Using Appropriate Hints
Query hints can override optimizer decisions (use sparingly):
-- Force specific index
SELECT * FROM Sales.Orders WITH (INDEX(IX_CustomerID))
WHERE CustomerID = 12345;

-- Force specific join type
SELECT *
FROM Sales.Orders o
INNER HASH JOIN Sales.Customers c ON o.CustomerID = c.CustomerID;

-- Disable parallelism
SELECT * FROM Sales.Orders
WHERE OrderDate > '2024-01-01'
OPTION (MAXDOP 1);

-- Force recompilation
SELECT * FROM Sales.Orders
WHERE CustomerID = @CustomerID
OPTION (RECOMPILE);
⚠️ Warning: Hints override the optimizer and can cause problems when data patterns change. Use only when necessary and document why.
8.5 Query Rewriting
OR to UNION ALL
-- Problem: OR prevents index usage
SELECT * FROM Sales.Orders
WHERE CustomerID = 100 OR OrderStatus = 'Pending';

-- Solution: UNION ALL (if no duplicates expected)
SELECT * FROM Sales.Orders WHERE CustomerID = 100
UNION ALL
SELECT * FROM Sales.Orders WHERE OrderStatus = 'Pending' AND CustomerID != 100;
Subquery to JOIN
-- Potentially inefficient subquery
SELECT CustomerName,
    (SELECT COUNT(*) FROM Sales.Orders o WHERE o.CustomerID = c.CustomerID) AS OrderCount
FROM Sales.Customers c;

-- Better: JOIN with GROUP BY
SELECT c.CustomerName, COUNT(o.OrderID) AS OrderCount
FROM Sales.Customers c
LEFT JOIN Sales.Orders o ON c.CustomerID = o.CustomerID
GROUP BY c.CustomerID, c.CustomerName;
9. Advanced Topics
9.1 Parallel Execution Plans
SQL Server can split queries across multiple CPUs:
- Parallelism Operators: Distribute Streams, Gather Streams, Repartition Streams
- Cost Threshold: Queries with cost > “cost threshold for parallelism” setting
- MAXDOP: Controls degree of parallelism
- CXPACKET Waits: Can indicate parallelism coordination overhead
-- Check current parallelism settings
SELECT name, value_in_use
FROM sys.configurations
WHERE name IN ('cost threshold for parallelism', 'max degree of parallelism');

-- Force serial execution
SELECT * FROM Sales.Orders
OPTION (MAXDOP 1);

-- Allow specific degree of parallelism
SELECT * FROM Sales.Orders
OPTION (MAXDOP 4);
9.2 Batch Mode vs. Row Mode
SQL Server 2019+ can use batch mode even without columnstore indexes:
- Row Mode: Processes one row at a time (traditional)
- Batch Mode: Processes ~900 rows at once (faster for analytics)
- Batch Mode on Rowstore: Available with compatibility level 150+
9.3 Adaptive Query Processing
SQL Server 2017+ includes intelligent query processing features:
- Adaptive Joins: Switches between Nested Loops and Hash Join at runtime
- Memory Grant Feedback: Adjusts memory grants based on actual usage
- Interleaved Execution: Better estimates for multi-statement TVFs
- Approximate COUNT DISTINCT: Fast approximation for large datasets
9.4 Plan Cache and Recompilation
Understanding plan cache behavior:
-- View cached plans
SELECT
    cp.objtype,
    cp.usecounts,
    cp.size_in_bytes / 1024 AS size_kb,
    qt.text AS query_text,
    qp.query_plan
FROM sys.dm_exec_cached_plans cp
CROSS APPLY sys.dm_exec_sql_text(cp.plan_handle) qt
CROSS APPLY sys.dm_exec_query_plan(cp.plan_handle) qp
ORDER BY cp.usecounts DESC;

-- Clear plan cache (use with extreme caution!)
-- DBCC FREEPROCCACHE;

-- Clear cache for specific database
-- DBCC FREEPROCCACHE;
-- ALTER DATABASE SCOPED CONFIGURATION CLEAR PROCEDURE_CACHE;
10. Best Practices
10.1 Execution Plan Analysis Checklist
- Get actual plan: Compare estimated vs. actual row counts
- Identify expensive operators: Look for high cost percentages (>10%)
- Check for warnings: Yellow triangles indicate problems
- Review data access: Prefer seeks over scans
- Examine join types: Ensure appropriate algorithms
- Look for implicit conversions: Check data type matches
- Check missing indexes: Green hints at top of plan
- Review memory grants: Look for spills to tempdb
- Validate statistics: Large estimate errors need statistics updates
- Enable IO/TIME stats: Measure actual resource consumption
10.2 Common Optimization Workflow
-- Step 1: Identify slow query (from DMVs or monitoring)
-- Step 2: Get actual execution plan
SET STATISTICS IO ON;
SET STATISTICS TIME ON;
-- Run your query
SET STATISTICS IO OFF;
SET STATISTICS TIME OFF;

-- Step 3: Analyze plan
-- - Look for scans on large tables
-- - Check for key lookups
-- - Review join algorithms
-- - Check for warnings

-- Step 4: Test optimizations
-- - Create indexes as suggested
-- - Rewrite non-SARGable predicates
-- - Update statistics if needed

-- Step 5: Compare before/after
-- - Logical reads (lower is better)
-- - CPU time (lower is better)
-- - Execution time (lower is better)

-- Step 6: Monitor in production
-- - Ensure consistent performance
-- - Watch for regressions
10.3 Documentation and Maintenance
- Save baseline plans: Export XML plans for future reference
- Document index changes: Note why indexes were created
- Regular statistics updates: Schedule during maintenance windows
- Monitor plan cache: Watch for plan regressions
- Review periodically: Execution plans can change with data growth
10.4 When NOT to Optimize
Not every query needs optimization:
- Queries that run rarely
- Queries that are already fast enough for business needs
- Queries on small tables (few thousand rows)
- Queries where the problem is external (network, application logic)
💡 Tip: Focus optimization efforts on queries that consume the most total resources (frequency × duration).
Conclusion
Execution plans are one of the most powerful tools for understanding and optimizing SQL Server performance. By mastering plan reading and interpretation, you can:
- Quickly diagnose performance problems
- Make informed indexing decisions
- Write more efficient queries
- Understand SQL Server’s query processing
- Communicate effectively about performance issues
Remember that execution plan analysis is both an art and a science. The optimizer makes good decisions most of the time, but understanding plans helps you identify the exceptions and opportunities for improvement.
Key Takeaways:
- Always compare estimated vs. actual row counts
- Focus on operators with high cost percentages
- Prefer index seeks over scans on large tables
- Write SARGable predicates to enable index usage
- Keep statistics up to date
- Use hints sparingly and document why
- Test changes in non-production first